Knowledge Base
What do benchmarks mean on the P&L?
Understanding P&L Benchmarks in Hedgi
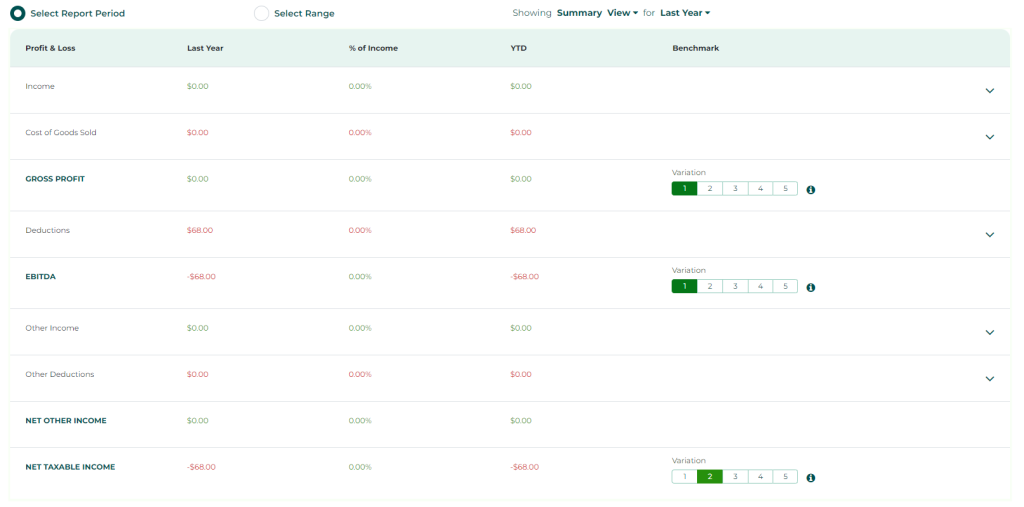
The Profit & Loss Statement in Hedgi displays helpful benchmark comparisons from our partner, Bizminer, so you can evaluate your business performance versus key industry standards.
The benchmark is presented on the sliding scale of 5% variation from the benchmark.
- Your KPI is less than 10% of the benchmark (material difference)
- Your KPI is less than 5% of the benchmark
- Your KPI is within 5% of the benchmark (matches benchmark)
- Your KPI is more than 5% of the benchmark
- Your KPI is more than 10% of the benchmark (material difference)
Key benchmarks shown include:
- Gross Profit Margin – Shows your gross profit as a percentage of revenue compared to your industry average.
- EBITDA Margin – Compares your earnings before interest, tax, depreciation and amortization margin to other businesses in your sector.
- Net Taxable Income – Benchmarks your net income margin to typical ranges for your industry.
Analyzing these P&L benchmarks allows you to quickly identify if your margins and profitability are above, below, or on par with competitors and peers, also if your financial carries significant audit risk.
The built-in industry benchmarks provide an invaluable perspective for assessing your business’ profit drivers, cost structure, and overall financial health compared to common rules of thumb.